Tech Stuff Tales from the trenches
Simple Composite Metrics
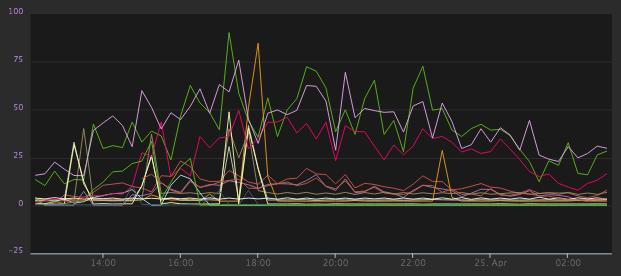
I recently tweeted a graph displaying performance data comparing old versus new infrastructure after a server move and partial upgrade. The graph is generated by Librato Metrics, a service I’ve been using for some time, and I’d like to explain a bit more about how I put this graph together using their excellent new composite metrics feature.
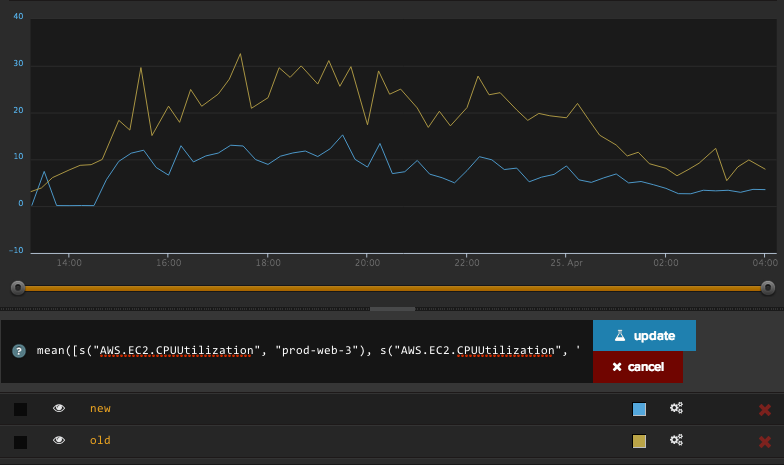
The first graph was to show mean CPU usage. I'm using the AWS integration Librato offers, and the data for this metric comes in as a single stream named AWS.EC2.CPUUtilization.
Adding this to an instrument displays a series for every server that is reporting it (some are production web servers, some batching processing, some less used test servers, etc...). But out of this myriad of sources we want to collect together just two series. Enter composite metrics.
mean(
  [
    series("AWS.EC2.CPUUtilization", "prod-web-3"),
    series("AWS.EC2.CPUUtilization", "prod-web-4"),
    // etc
  ]
)
Reading from inside out, first the series() function. This usually takes a minimum of two arguments, the name of the metric to select, and the source to select it from. You can use wildcards here to match multiple metrics/sources and they'll be combined to a single series. For example...
series("AWS.EC2.CPUUtilization", "prod-web-*")
Will select the CPU metrics for all the production web servers (the source name is just an arbitrary string by the way, this is up to you when you're pumping this data into Librato).
So in my example we select the individual metrics per-server and collect them into an array (that's the [] syntax). This array is then fed into the mean() function which outputs a single series calculating the mean of its sources. I created two of these composite metrics, one for old and one for new. And here's how it looks...
I used the same technique for a bunch of other data points I was interested in and presented them on a dashboard for sharing. The step up in functionality and usefulness this feature gives is awesome, and I'll try to show more of it in the future.